almoamen.net
Data tables
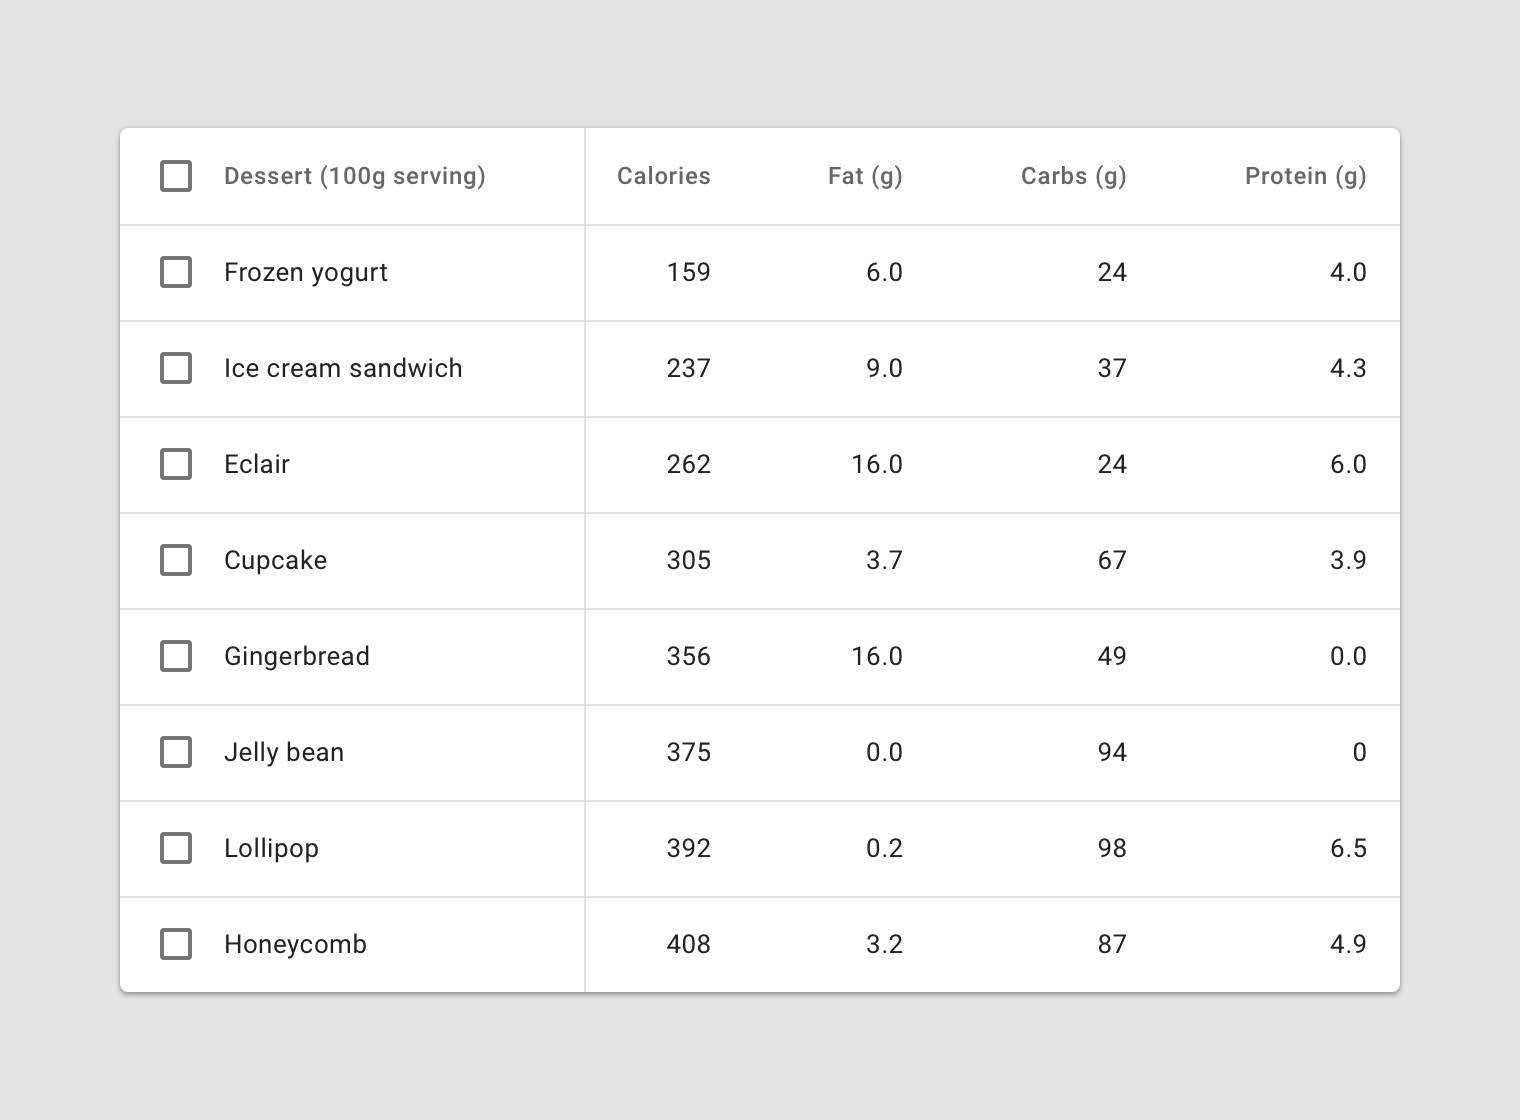
Data tables display sets of data.
Usage
Data tables display information in a way that’s easy to scan, so that users can look for patterns and insights. They can be embedded in primary content, such as cards.
Data tables can include:
- A corresponding visualization
- Navigation
- Tools to query and manipulate data
When including tools, they should be placed directly above or below the table.
Principles
Hierarchical
Data table content should be hierarchical, alphabetical, or similarly organized.
Interactive
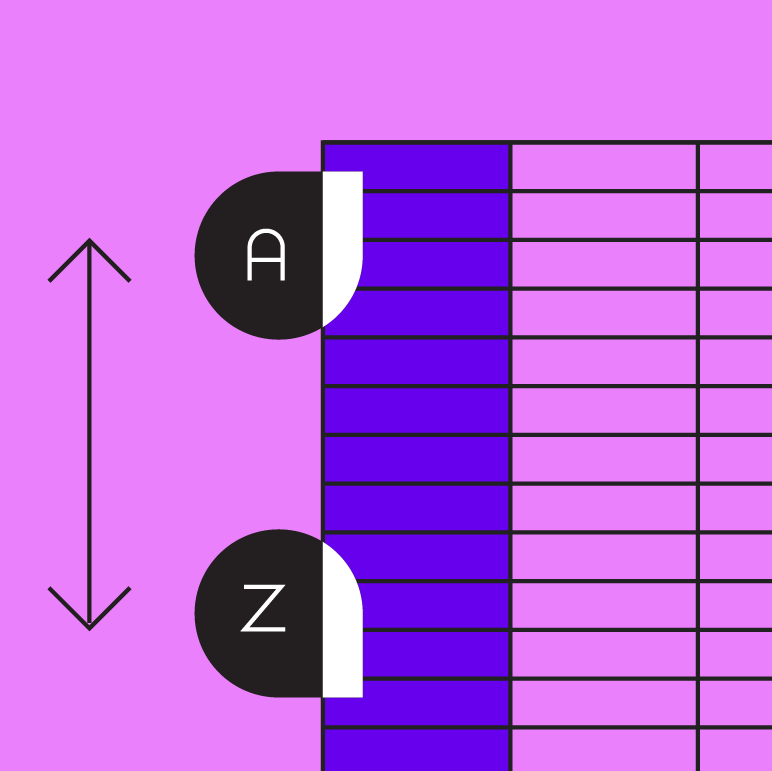
Data tables should allow user interaction, so that users can sort information in custom ways.

Intuitive
Data tables should work intuitively, allowing users to focus on content, not structure.
Anatomy
Data tables can include three or more columns. A header row at the top lists column names, and all subsequent rows contain data. Data tables can include a corresponding visualization, such as a graph.
If users need to interact with row data, checkboxes should accompany each row.
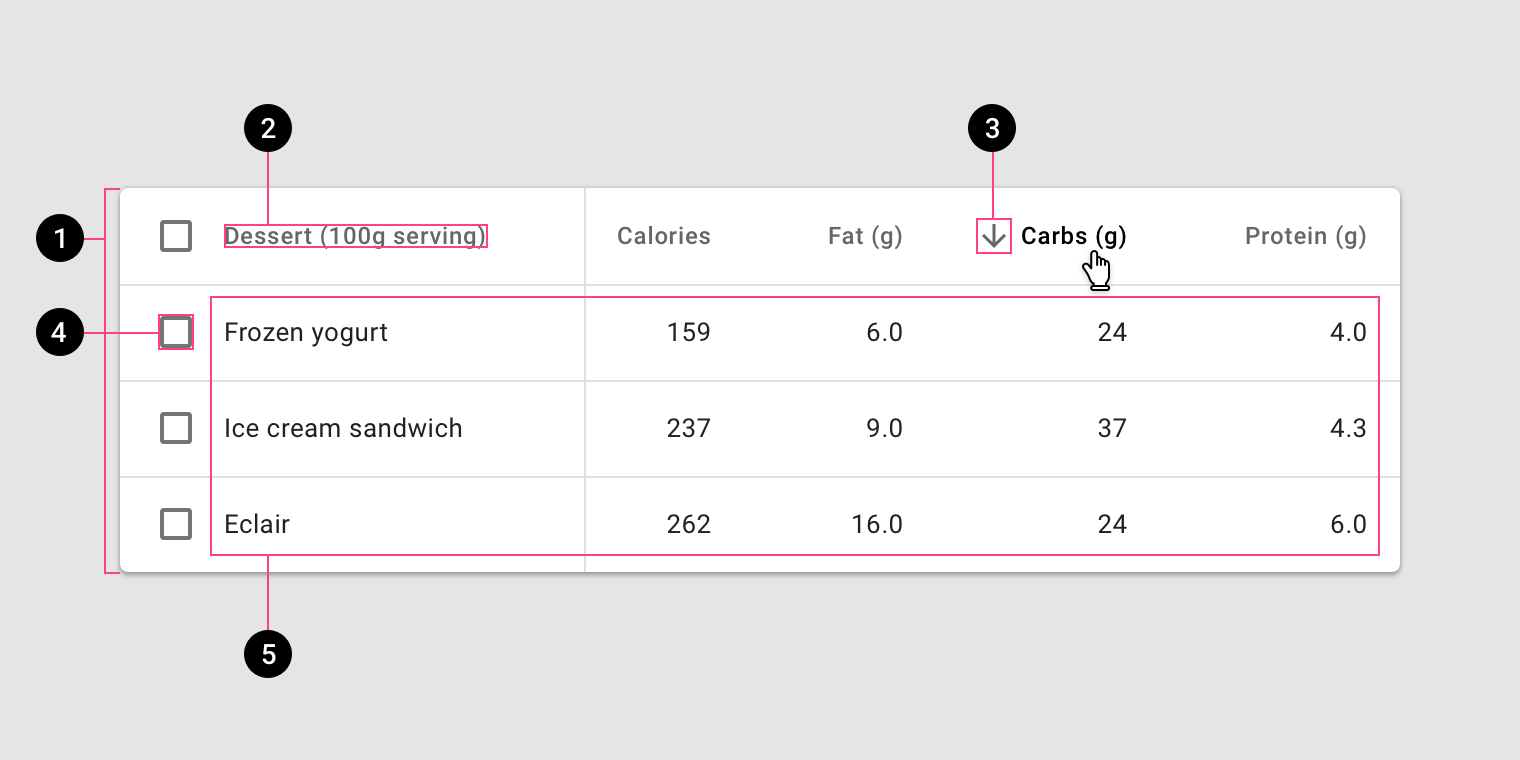
1. Container
The container holds all data table content.
2. Column header
Column headers are titles for column content.
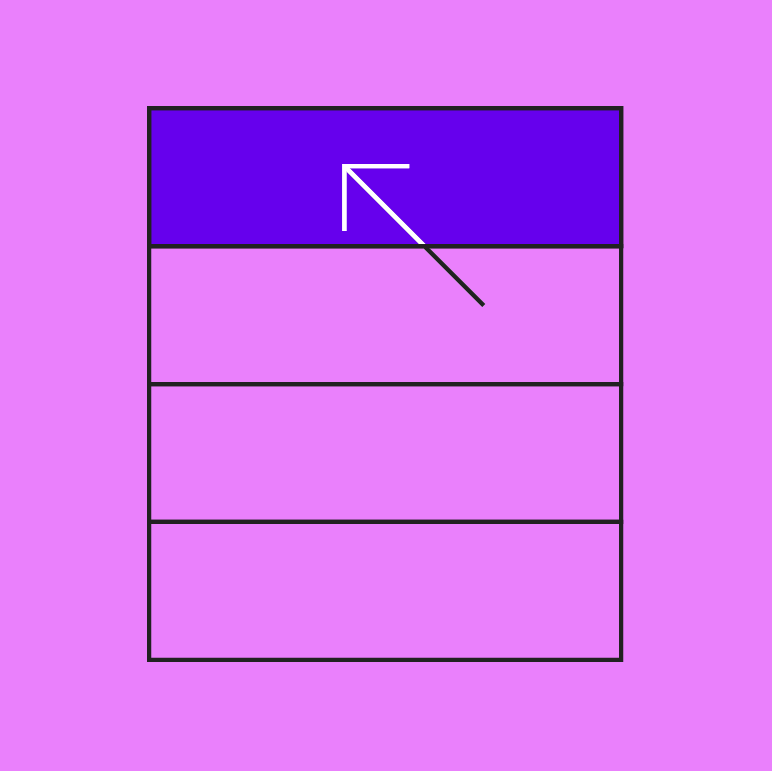
3. Sorting tool
Sorting tools allow users to reorder table content, appearing only on hover.
4. Row checkbox
Checkboxes allow users to select a row.
5. Table content
Tables contain raw data.
Column header
By default, there is 56dp of padding between columns. Column headers that extend into this padding can either:
- Enable horizontal scrolling, so users can scroll to see the full column name
- Shorten the column name, while displaying it in full in a tooltip (on hover)
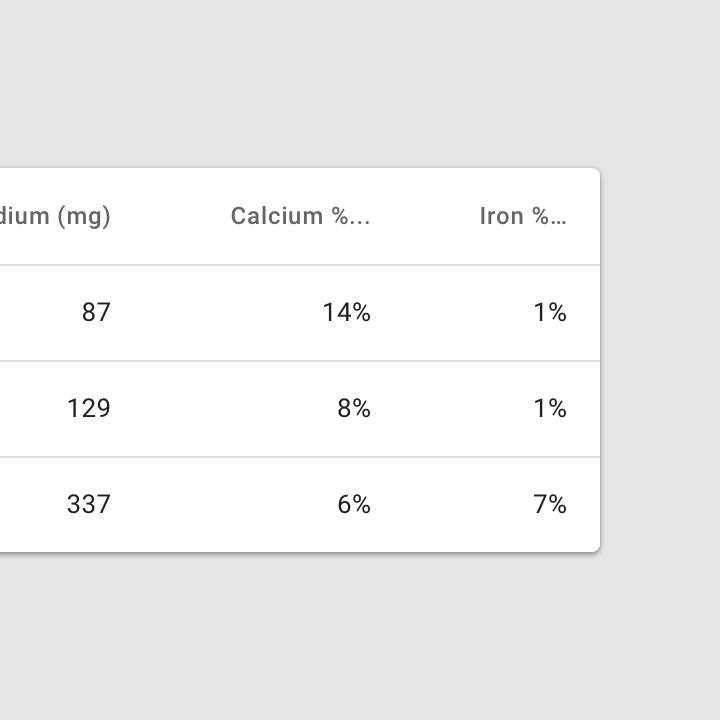
Long column headers are truncated with an ellipse.
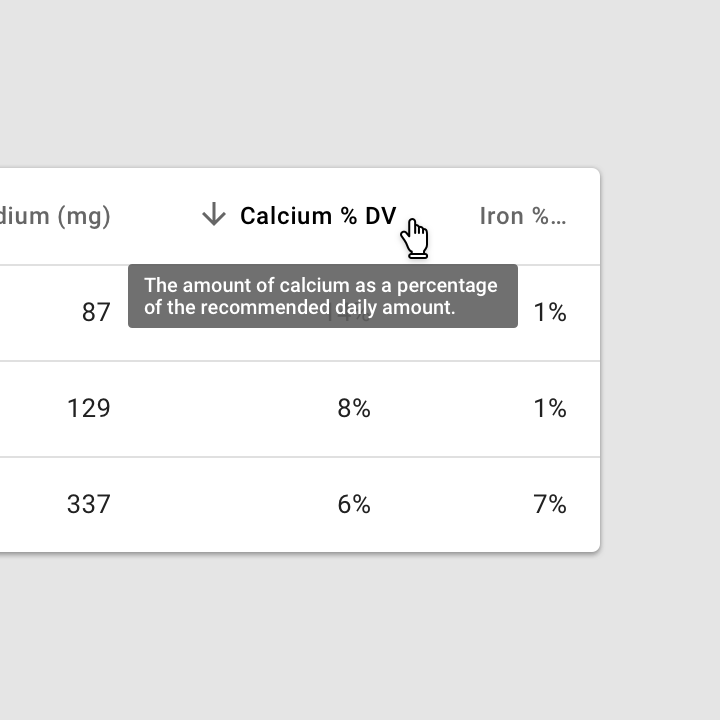
Hovering over a truncated column header reveals the full text, using a tooltip.
Sorting tool
If sorting is enabled, the left-most column is sorted by default, with an indicator displayed in the column header. Tapping the header of the sorting column reverses the sort order, also rotating the sort icon 180 degrees.

Table with a sorting tool.
Row Checkbox
When a checkbox for a row is selected, the row should display a background color.
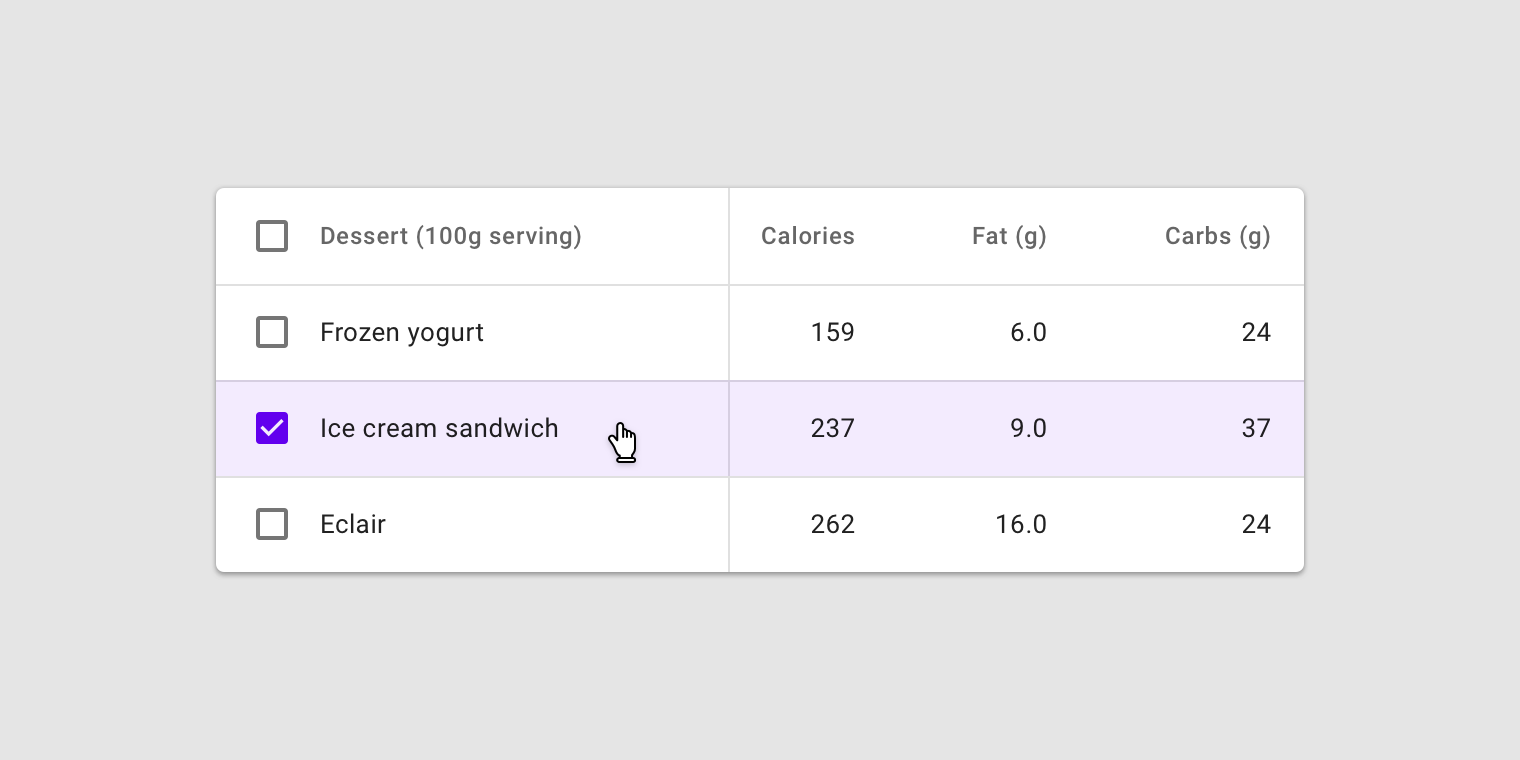
A selected row checkbox.
Behavior
Row hover (Desktop)
If a user hovers over a row, display a background color in that row. If individual table cells have specific hover states, display both that cell’s hover state as well as the row hover state.
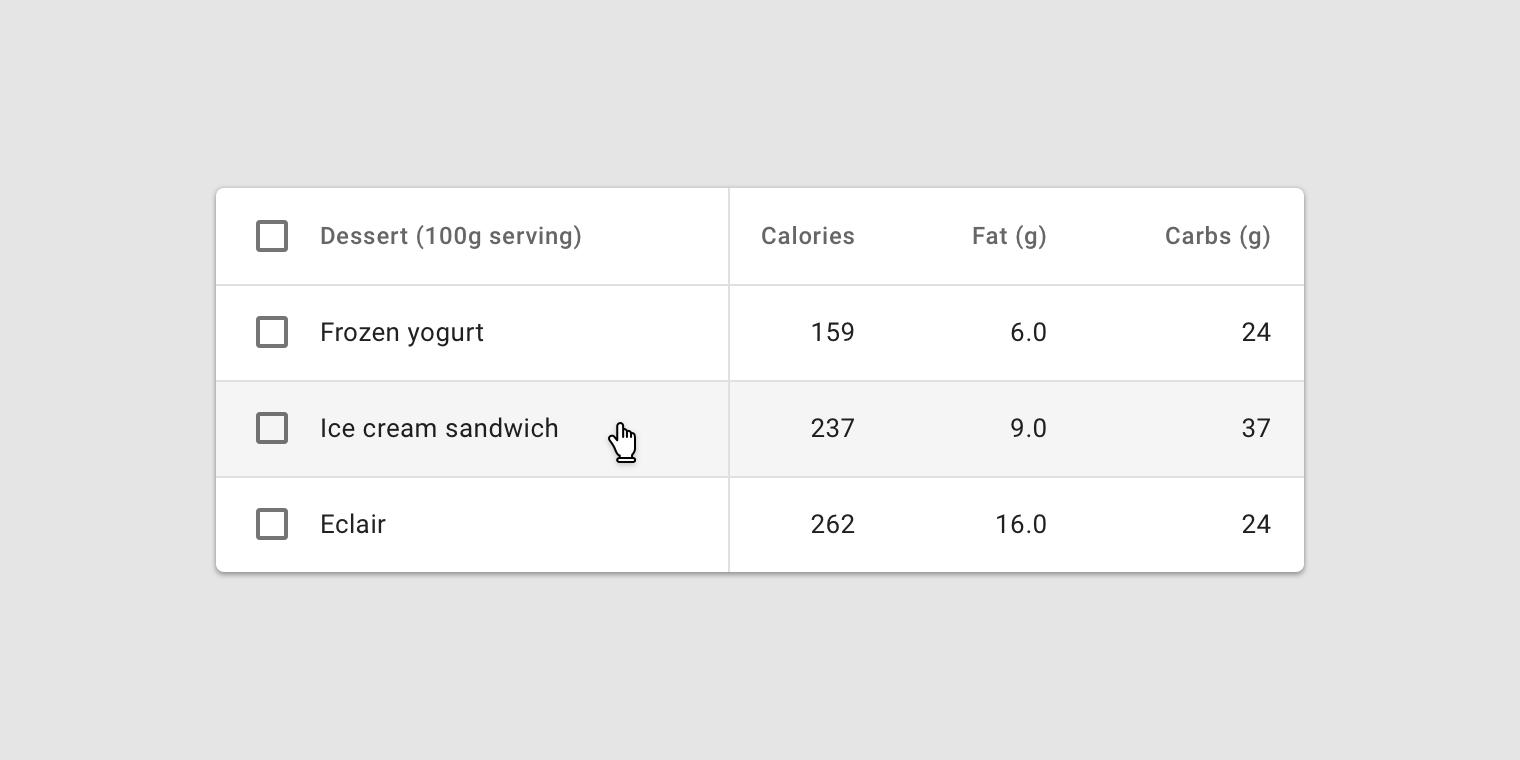
Hovering over a row.
Column hover (Desktop)
On hover, two things can be displayed:
- A tooltip displaying more information about each column header
- A sort icon in the column header, if sorting is enabled
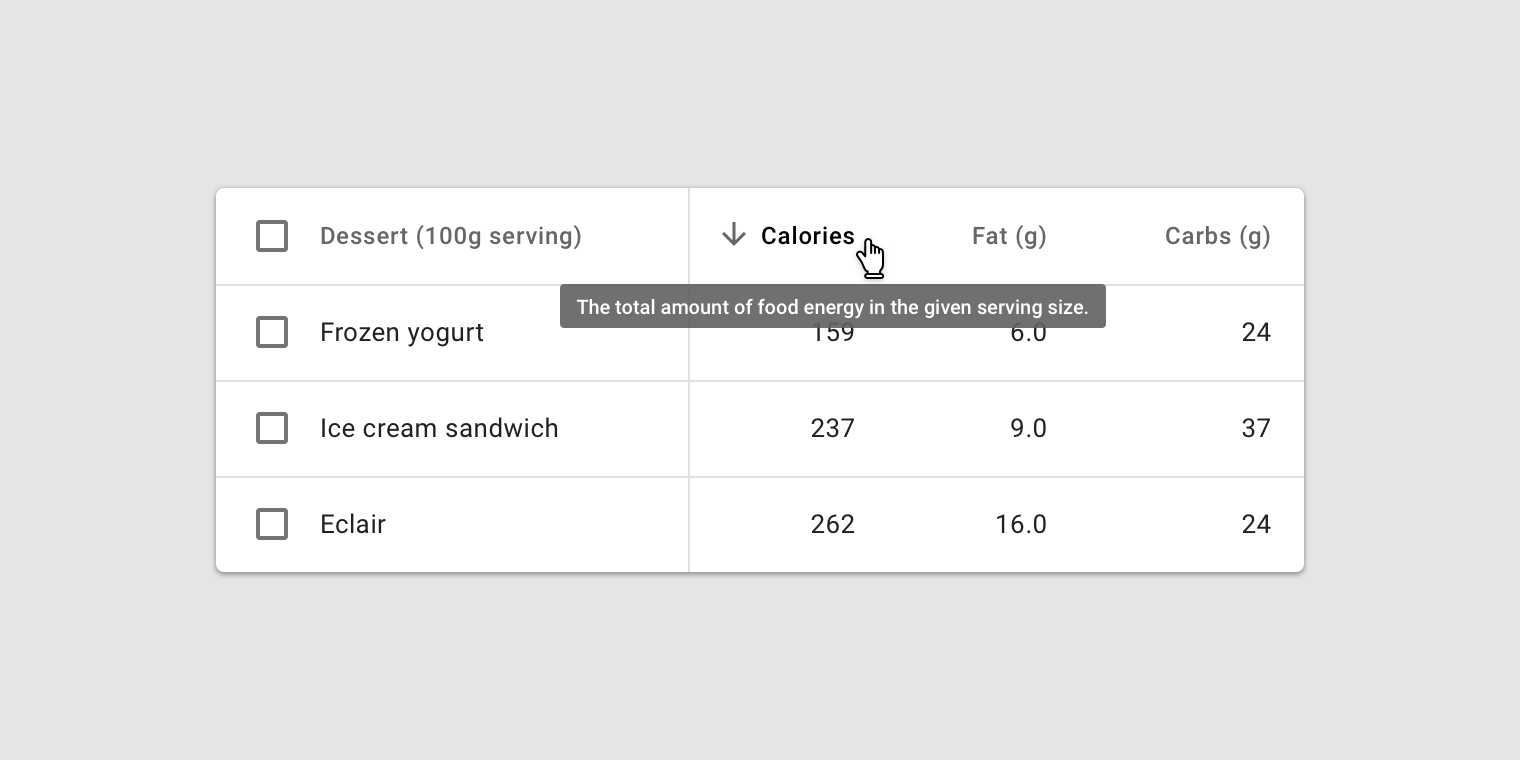
A tooltip and sort icon can be displayed when hovering over a column name.
Inline text editing
Tables can include editable fields for text editing or adding comments. They are indicated by placeholder text in the field. On tap, an edit dialog with a text field or a full dialog is displayed.
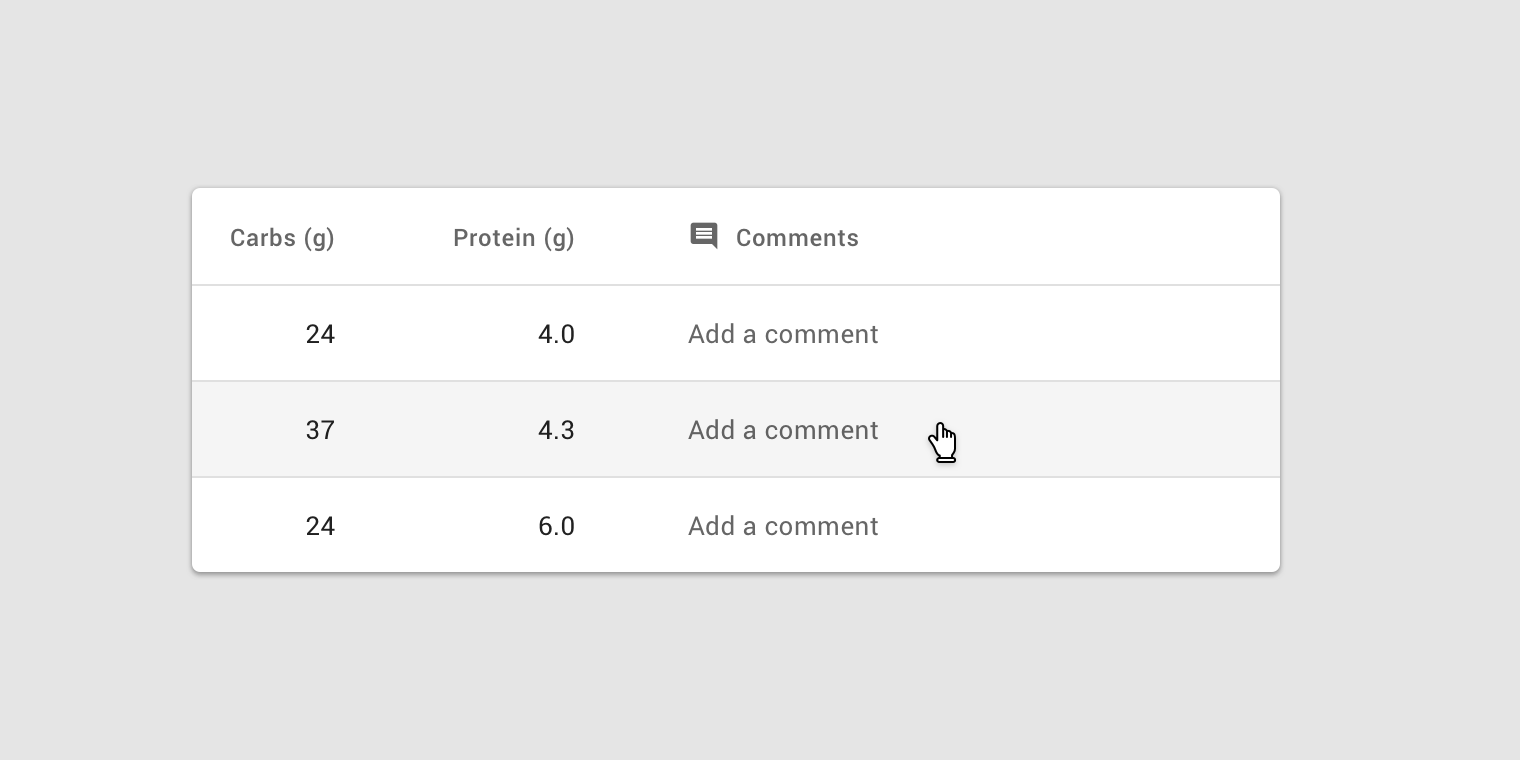
An editable table cell with placeholder text.
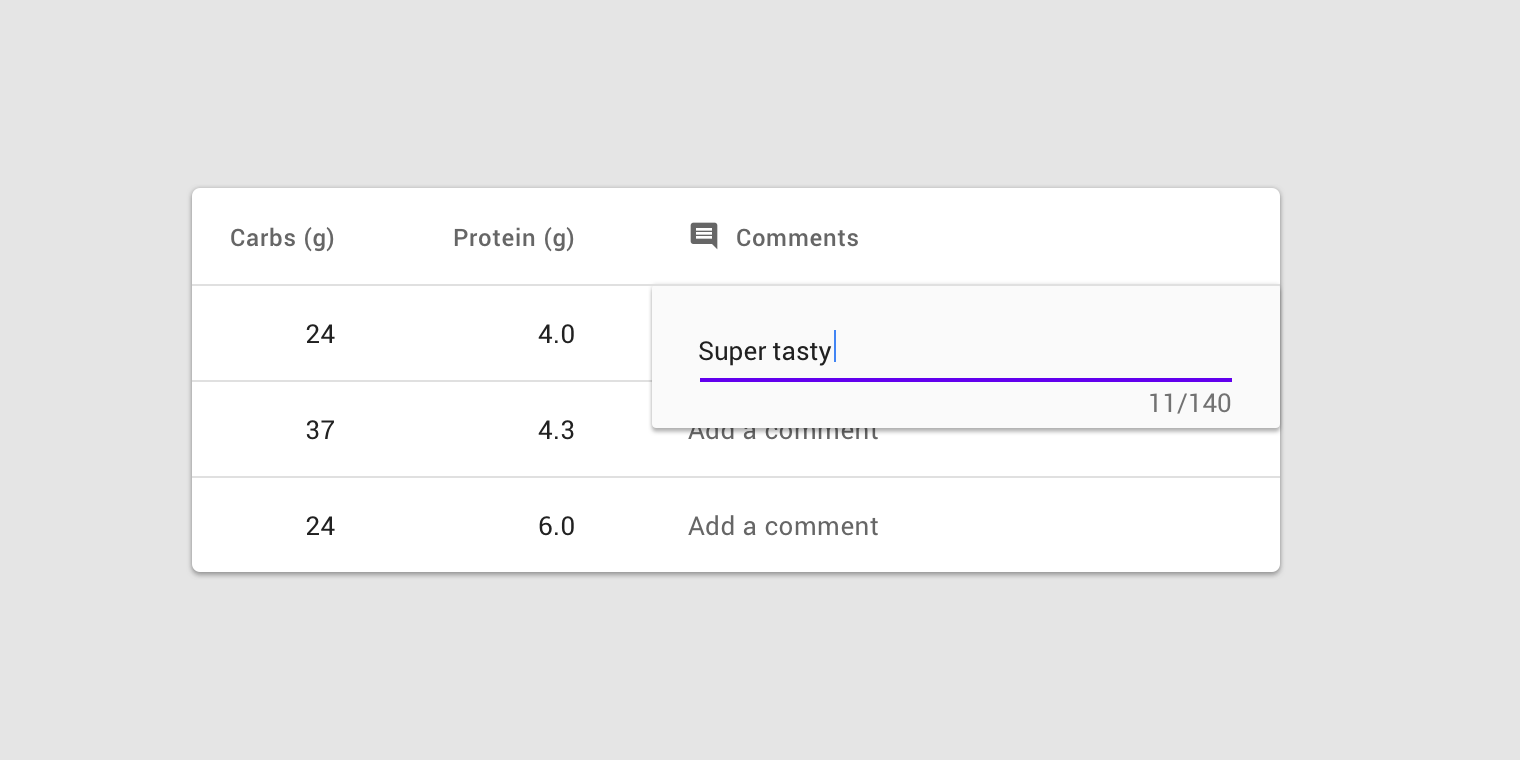
Small edit dialog
Text can be edited using a small edit dialog, allowing users to confirm text by pressing Enter. Dialog edges should align with nearest divider line or table edge.
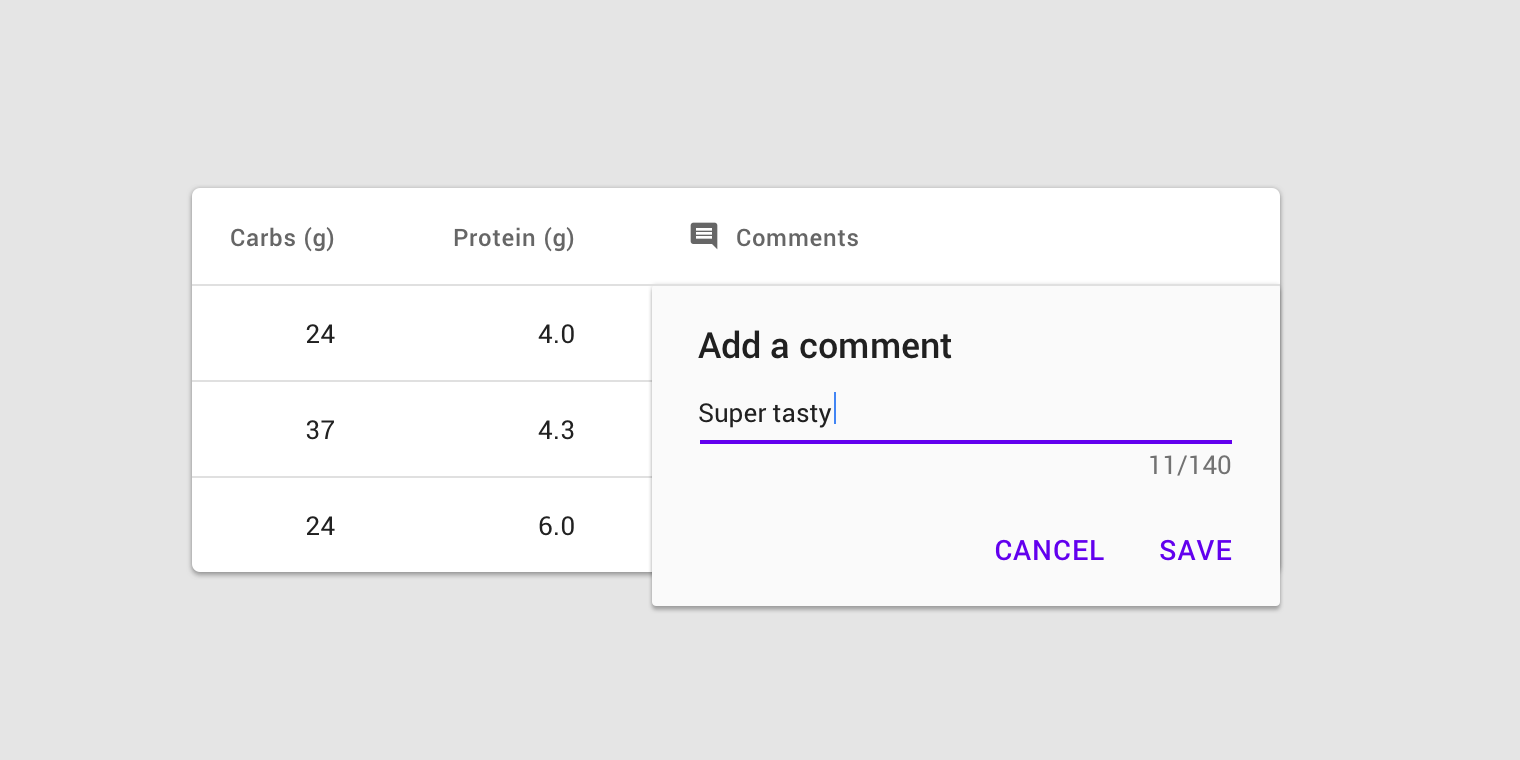
Large edit dialog
A large edit dialog is a complex, flexible dialog box. Users confirm text by tapping the Save button. Dialog edges should align with the nearest divider line or table edge.
Inline edit icon (Optional)
An inline edit icon allows field editing, with an icon at the opposite end of the cell from content.

Inline menus
Inline menus allow users to select from a predefined list of options. These menus can be directly embedded in a table.
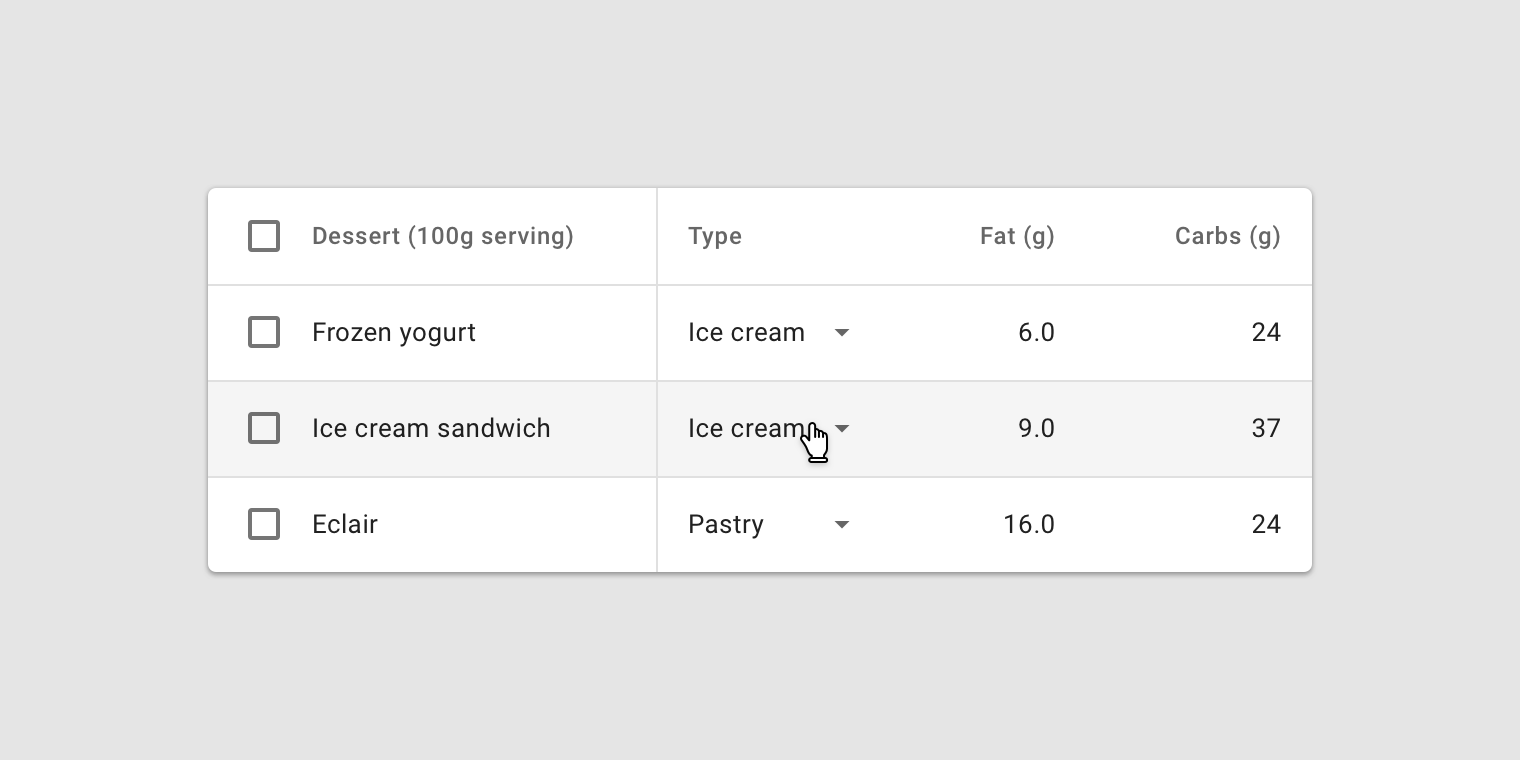
A table with inline menus.
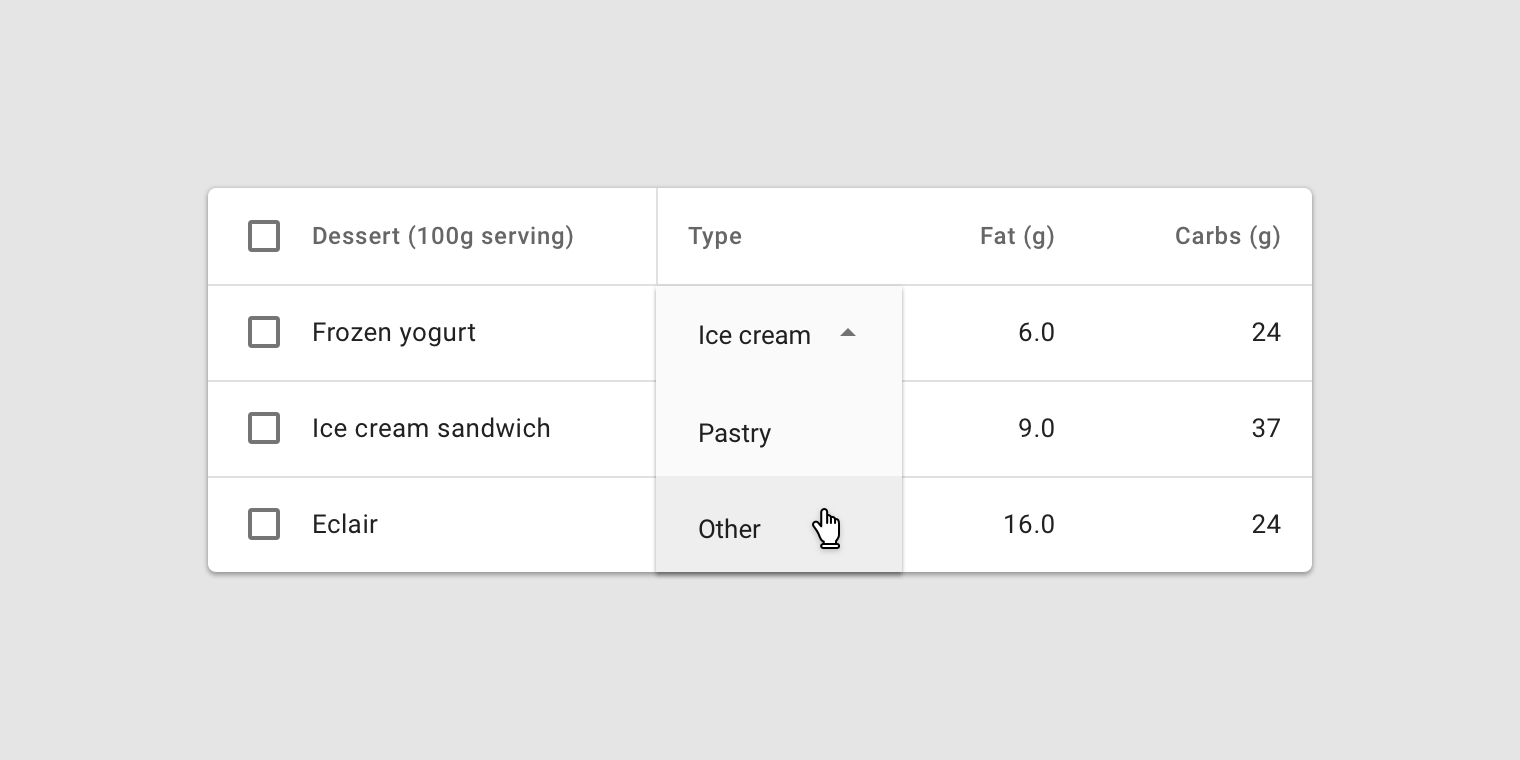
An expanded inline menu.
Tables within cards
Tables can be embedded within a card. At the bottom of each card, tools can be displayed for table navigation and data manipulation.
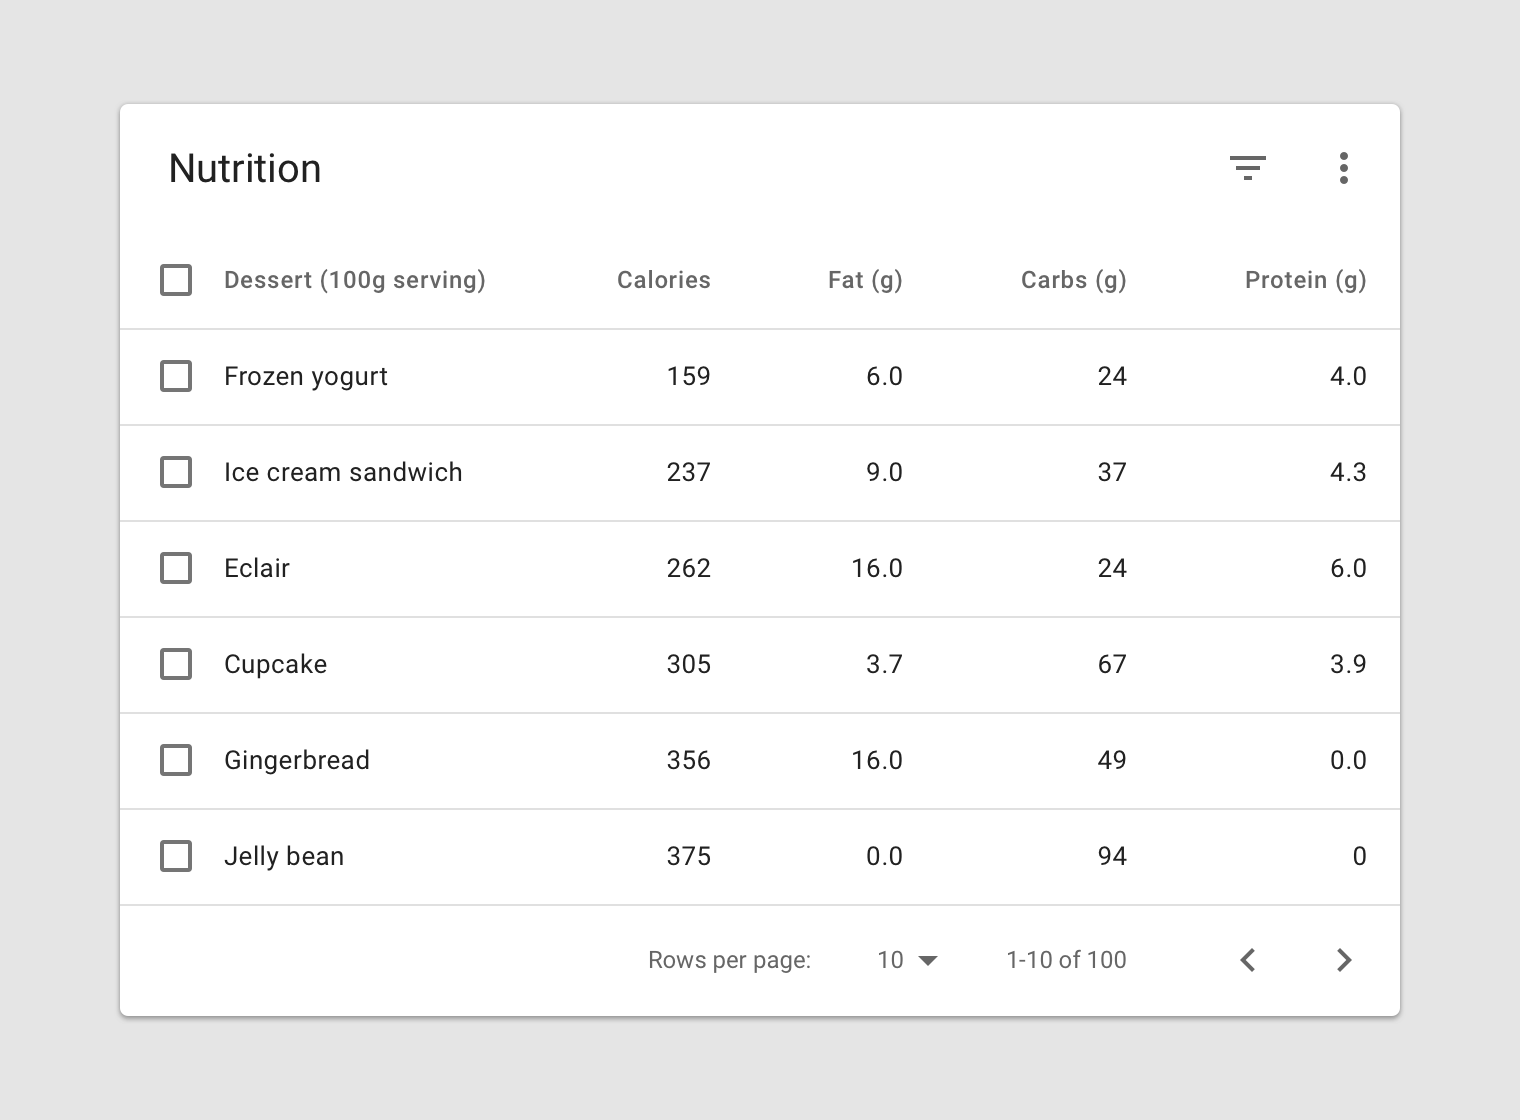
Table card with header and footer.
Data table card headers
When tables in cards require actionable headers instead of titles, you can either:
- Display persistent actions
- Display a contextual header that indicates when items are selected
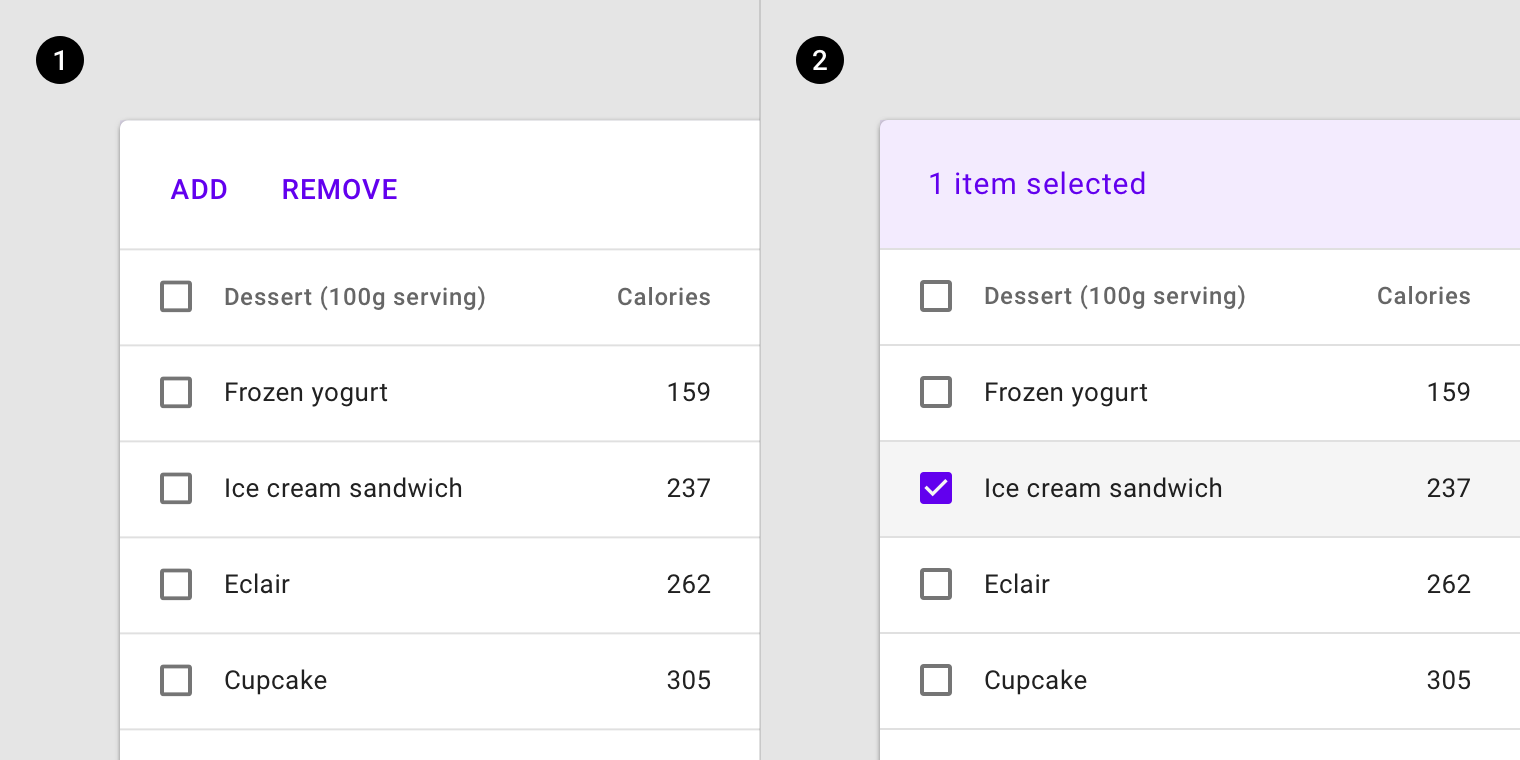
- Action buttons
- Colored header
|
|
Calcium (%) | ||
|---|---|---|---|
|
|
159
|
4.0
|
14%
|
|
|
237
|
4.3
|
8%
|
|
|
262
|
6.0
|
7%
|
Default data table with checkboxes.
<div class="mdc-data-table">
    <div class="table-container">
        <table>
            <thead>
                <tr>
                    <th>
                        <div class="mdc-checkbox lime-800" tabindex="-1">
                            <input type="hidden" value="0">
                        </div>
                        <button class="column-sort">Dessert (100g serving)</button>
                    </th>
                    <th class="direction-reverse">
                        <button class="column-sort">Calories</button>
                    </th>
                    <th class="direction-reverse">
                        <button class="column-sort asc">Protein (g)</button>
                    </th>
                    <th class="direction-reverse">Calcium (%)</th>
                </tr>
            </thead>
            <tbody>
                <tr class="lime-800">
                    <td>
                        <div class="cell-data">
                            <div class="mdc-checkbox" tabindex="-1">
                                <input type="hidden" value="0">
                            </div>
                            Frozen yogurt
                        </div>
                    </td>
                    <td class="direction-reverse">
                        <div class="cell-data">159</div>
                    </td>
                    <td class="direction-reverse">
                        <div class="cell-data">4.0</div>
                    </td>
                    <td class="direction-reverse">
                        <div class="cell-data">14%</div>
                    </td>
                </tr>
                .
                .
                .
            </tbody>
        </table>
    </div>
</div>
| Protein (g) | ||||
|---|---|---|---|---|
|
Frozen yogurt
|
159
|
4.0
|
14%
|
|
|
Ice cream sandwich
|
237
|
4.3
|
8%
|
|
|
Eclair
|
262
|
6.0
|
7%
|
|
Data table within a card.
<div class="mdc-data-table mdc-card">
    <div class="table-container">
        <table>
            <thead>
                <tr>
                    <th>
                        <button class="column-sort">Dessert (100g serving)</button>
                    </th>
                    <th class="direction-reverse">
                        <button class="column-sort">Calories</button>
                    </th>
                    <th class="direction-reverse">Protein (g)</th>
                    <th class="direction-reverse">
                        <button class="column-sort desc">Calcium (%)</button>
                    </th>
                    <th></th>
                </tr>
            </thead>
            <tbody>
                <tr class="lime-800">
                    <td>
                        <div class="cell-data">Frozen yogurt</div>
                    </td>
                    <td class="direction-reverse">
                        <div class="cell-data">159</div>
                    </td>
                    <td class="direction-reverse">
                        <div class="cell-data">4.0</div>
                    </td>
                    <td class="direction-reverse">
                        <div class="cell-data">14%</div>
                    </td>
                    <td>
                        <div class="cell-data action-container">
                            <div class="actions">
                                <div class="action-item">
                                    <button class="icon material-icon">edit</button>
                                </div>
                            </div>
                        </div>
                    </td>
                </tr>
                .
                .
                .
            </tbody>
        </table>
    </div>
</div>
Nutritions
|
|
Protein (g) | ||
|---|---|---|---|
|
|
159
|
4.0
|
14%
|
|
|
237
|
4.3
|
8%
|
|
|
262
|
6.0
|
7%
|
Data table card with header and footer.
<div class="mdc-data-table mdc-card">
    <div class="header">
        <div class="table-title">Nutritions</div>

        <div class="actions">
            <div class="action-item"><button class="material-icon">filter_list</button></div>
            <div class="action-item"><button class="material-icon">more_vert</button></div>
        </div>
    </div>
    <div class="table-container">
        <table>
            .
            .
            .
        </table>
    </div>
    <div class="footer">
        <div class="pagination">
            <div class="link">
                <button class="icon material-icon">navigate_before</button>
            </div>
            <div class="link">
                <button class="icon material-icon">navigate_next</button>
            </div>
        </div>
        <div class="summary">1-10 of 100</div>
    </div>
</div>
|
|
Protein (g) | ||
|---|---|---|---|
|
|
159
|
4.0
|
14%
|
|
|
237
|
4.3
|
8%
|
|
|
262
|
6.0
|
7%
|
Data table card with a header containing persistent actions.
<div class="mdc-data-table mdc-card">
    <div class="header">
        <div class="mdc-button-group lime-800">
            <button class="mdc-button">Add</button>
            <button class="mdc-button">Remove</button>
        </div>

        <div class="actions">
            <div class="action-item"><button class="material-icon">filter_list</button></div>
        </div>

        <div class="actions">
            <div class="action-item"><button class="material-icon">filter_list</button></div>
            <div class="action-item"><button class="material-icon">more_vert</button></div>
        </div>
    </div>
    <div class="table-container">
        <table>
            .
            .
            .
        </table>
    </div>
</div>